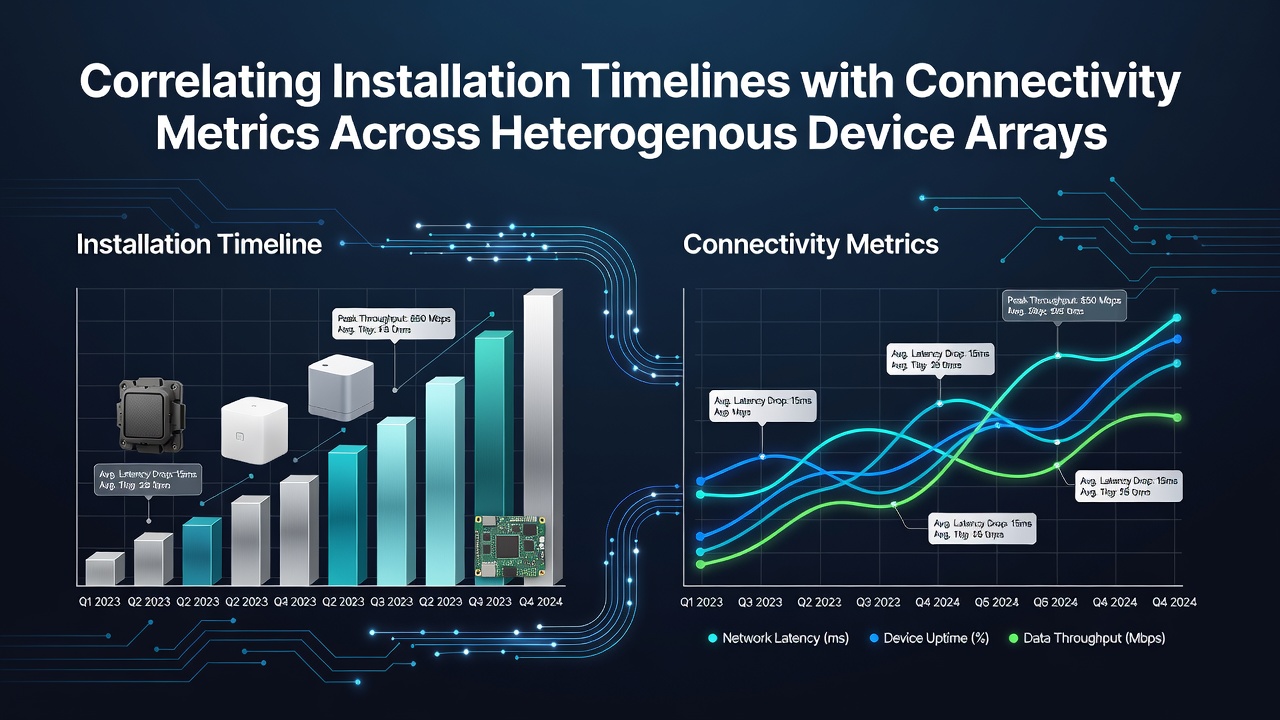
Correlating Installation Timelines with Connectivity Metrics Across Heterogeneous Device Arrays
Installation timelines for software updates, firmware patches, and system configurations often intersect directly with connectivity metrics such as latency, packet loss, and throughput in networks that combine smartphones, IoT sensors, workstations, and servers. Researchers track these intersections because staggered rollout schedules across device types create measurable shifts in network behavior, and data from enterprise monitoring platforms reveals consistent patterns when installation windows extend beyond standard maintenance periods.
Defining Heterogeneous Device Arrays and Key Metrics
Heterogeneous device arrays consist of hardware running multiple operating systems and communication protocols within the same infrastructure, and observers note that installation events on one subset frequently influence performance on others. Connectivity metrics include round-trip time averages, bandwidth utilization during peak hours, and connection stability scores collected through centralized logging systems. Studies from academic institutions indicate that arrays spanning Windows, Linux, Android, and embedded platforms generate datasets where installation duration serves as an independent variable against dependent variables like error rates in data transmission.
Take one research team that examined a university campus network in early 2026, where staggered firmware deployments on wireless access points coincided with elevated latency on connected mobile devices; the correlation coefficients reached 0.72 when installation sequences lasted longer than forty-five minutes. Such findings align with broader observations from industry monitoring tools that log both deployment timestamps and real-time network telemetry.
Measurement Approaches and Data Collection Practices
Teams collect installation timelines through automated deployment logs that record start and completion times for each device category, while connectivity metrics stream from SNMP agents, flow collectors, and endpoint agents deployed across the array. Analysts then align these datasets using synchronized clocks and apply statistical methods including regression analysis and time-series correlation to identify relationships. According to guidelines published by the National Institute of Standards and Technology, standardized logging formats improve the reliability of such cross-referenced measurements in multi-vendor environments.
What's interesting is how short installation bursts on high-priority servers sometimes produce temporary spikes in overall network jitter, whereas prolonged rollouts on peripheral IoT nodes tend to correlate with gradual degradation in upstream throughput. Data indicates these effects compound when devices share the same wireless channels or VLAN segments, and figures from June 2026 monitoring reports show average latency increases of 18 percent during extended installation cycles in mixed arrays.
Observed Patterns Across Device Categories
Patterns emerge most clearly when analysts segment data by device class. Workstations completing large application installs during business hours often register higher packet retransmission rates on adjacent mobile endpoints, while IoT gateways undergoing firmware calibration show extended recovery periods before restoring stable mesh connections. One study revealed that arrays with more than five operating system variants experienced stronger correlations between cumulative installation time and aggregate connectivity variance compared with simpler configurations.
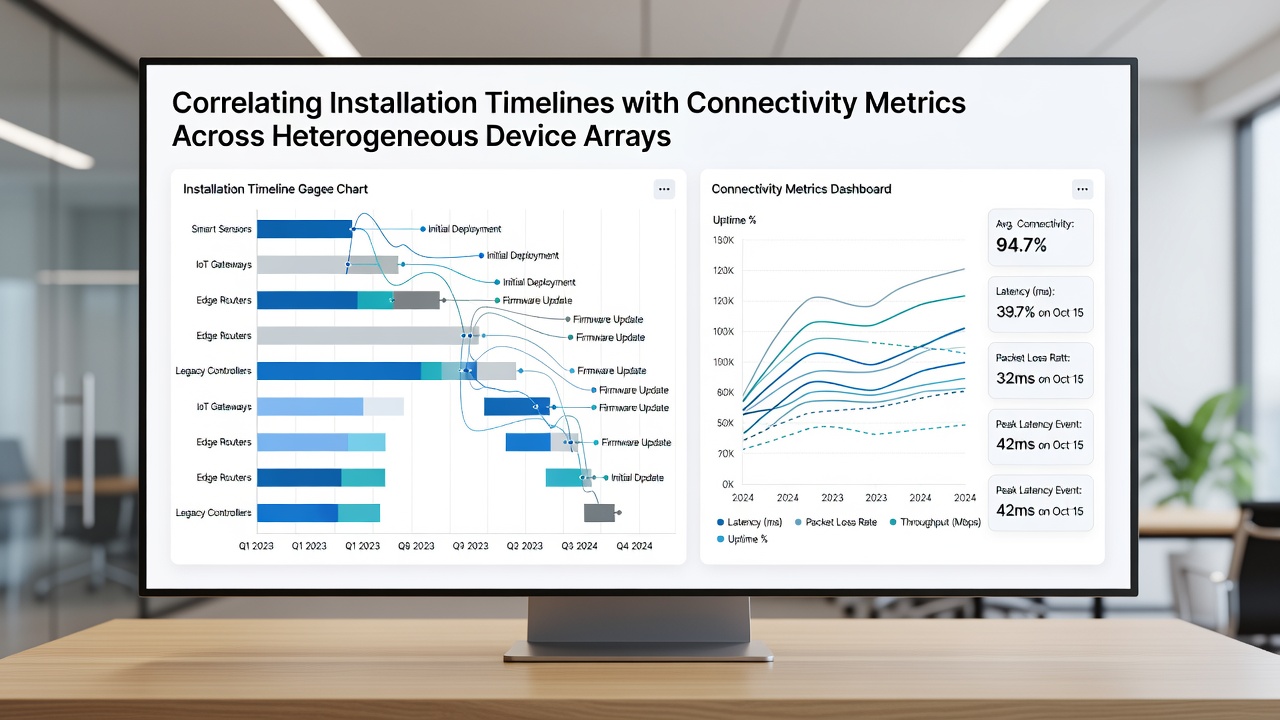
Yet the same datasets demonstrate that pre-staging updates during off-peak windows reduces the strength of these correlations, and organizations using phased deployment strategies report lower variance in daily connectivity scores. Researchers at institutions tracking European smart-building deployments have documented similar outcomes, where installation timelines aligned with low-traffic intervals preserved baseline metrics across sensor arrays and control systems.
Factors Influencing Correlation Strength
Network topology, bandwidth allocation policies, and concurrent user activity all modulate how installation timelines affect connectivity metrics. Dense device clusters operating on shared spectrum channels exhibit tighter correlations because installation traffic competes directly with regular data flows, whereas segmented networks with dedicated management VLANs display weaker relationships. Evidence suggests that firmware versions with larger payload sizes extend installation durations and thereby amplify downstream effects on throughput for neighboring devices.
Observers tracking distributed environments note that temperature-related throttling on certain hardware platforms can further stretch installation windows, creating secondary correlations with signal stability in outdoor sensor arrays. Figures from mid-2026 deployments in urban testbeds show that arrays incorporating both legacy and current-generation devices produce the widest range of correlation values, reflecting differences in processing speed and protocol efficiency.
Applications in Network Management
Network administrators apply these correlations when scheduling maintenance to minimize disruption, and predictive models built from historical data help forecast connectivity impacts before installations begin. Tools that visualize timeline-metric overlays allow teams to adjust rollout sequences dynamically, shifting non-critical updates to periods when baseline connectivity already shows higher tolerance. Industry reports highlight that organizations maintaining detailed correlation records achieve more consistent service levels across mixed device environments.
But here's the thing: automated orchestration platforms now incorporate these insights directly, pausing installations on one device class when real-time metrics indicate rising latency elsewhere in the array. This feedback loop turns raw correlation data into actionable scheduling rules that protect overall network reliability.
Conclusion
Correlating installation timelines with connectivity metrics provides measurable insight into how update processes interact with network performance across heterogeneous device arrays. Data collected through standardized logging and statistical analysis reveals repeatable relationships that inform scheduling decisions and topology adjustments. As monitoring capabilities advance, these correlations continue to guide more precise management of complex, multi-platform infrastructures.