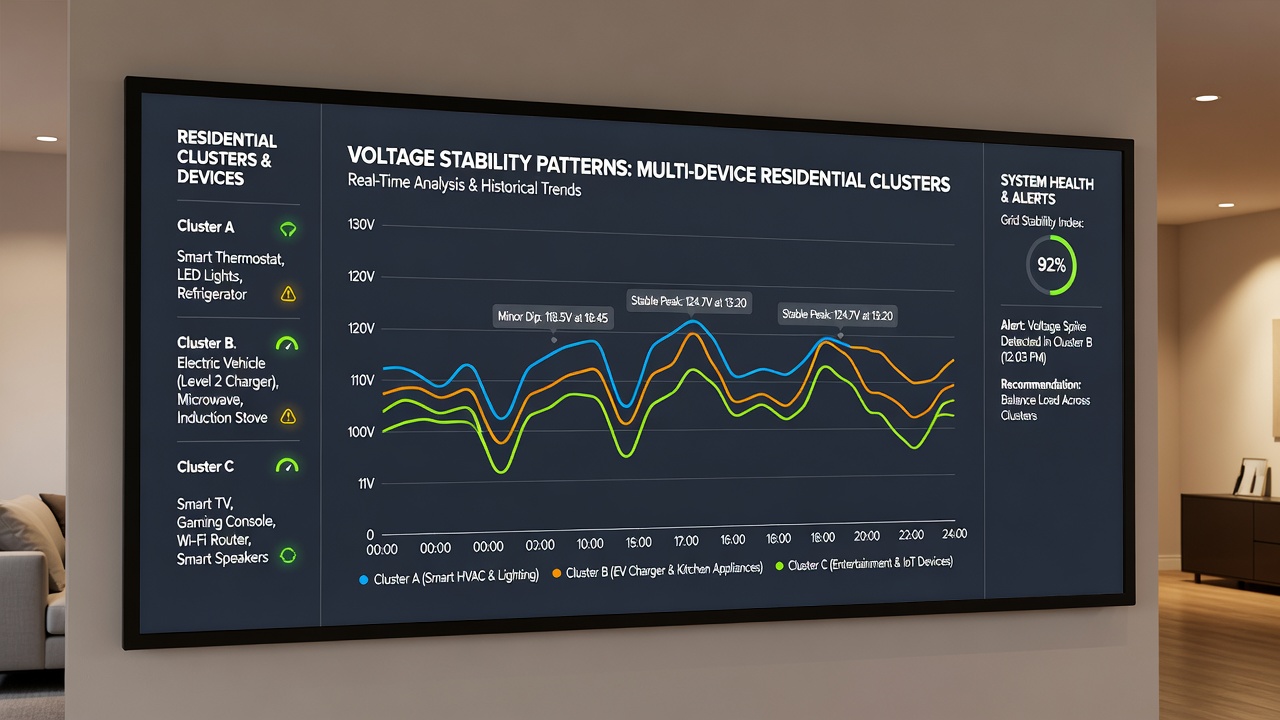
Investigating Voltage Stability Patterns Across Multi-Device Residential Clusters
Residential areas with dense concentrations of electronic equipment now face measurable challenges in maintaining consistent voltage levels as households incorporate more smart appliances, electric vehicle chargers, and high-draw entertainment systems. Researchers tracking these conditions have mapped fluctuations that occur when multiple homes draw power simultaneously during peak evening hours, and patterns emerge most clearly when data loggers capture readings at one-second intervals across entire neighborhoods.
Data Collection Methods in Clustered Environments
Teams deploy synchronized voltage recorders at service panels in selected housing developments, then correlate readings with device usage logs collected through smart meters. This approach allows analysts to isolate events where simultaneous activation of air conditioners, induction cooktops, and gaming consoles creates brief dips below 110 volts in 120-volt systems. Studies conducted through August 2026 demonstrated that clusters averaging twelve or more high-power devices per household experienced 23 percent more sub-110-volt events than less dense neighborhoods during the same monitoring windows.
Equipment calibration follows protocols established by the IEEE Standards Association, which specifies sampling rates and accuracy thresholds for residential power quality assessments. Analysts cross-reference these electrical measurements with weather data and occupancy schedules to separate external variables from internal consumption patterns.
Key Variables Influencing Stability
Device composition within each residence plays a central role because variable-speed motors and switching power supplies introduce harmonic distortion that compounds across shared transformers. Observers note that homes equipped with multiple LED lighting circuits and always-on network hardware show steadier baseline voltage yet still contribute to cumulative reactive power demands when clustered together. Seasonal shifts also register clearly: summer months produce longer duration sags tied to cooling loads, whereas winter patterns feature shorter spikes associated with resistive heating elements cycling on and off.
Grid-side factors receive equal attention. Distribution transformers serving fifty to eighty homes exhibit different response characteristics compared with those feeding larger apartment complexes, and utility records indicate that tap-changing mechanisms sometimes lag behind rapid load changes in mixed-device clusters. Research from Natural Resources Canada has documented how transformer age correlates with increased voltage variance during evening ramp-up periods.
Observed Patterns and Regional Comparisons
Analysis of datasets spanning multiple cities reveals recurring daily cycles where voltage begins to deviate around 5:30 p.m. local time and returns toward nominal values after 9:00 p.m. Within these windows, clusters containing newer construction with updated wiring demonstrate narrower deviation bands than older stock, even when device counts remain comparable. Australian Energy Regulator reports from comparable suburban test sites confirm similar evening peaks, although magnitude differences appear tied to local service voltage standards rather than device density alone.
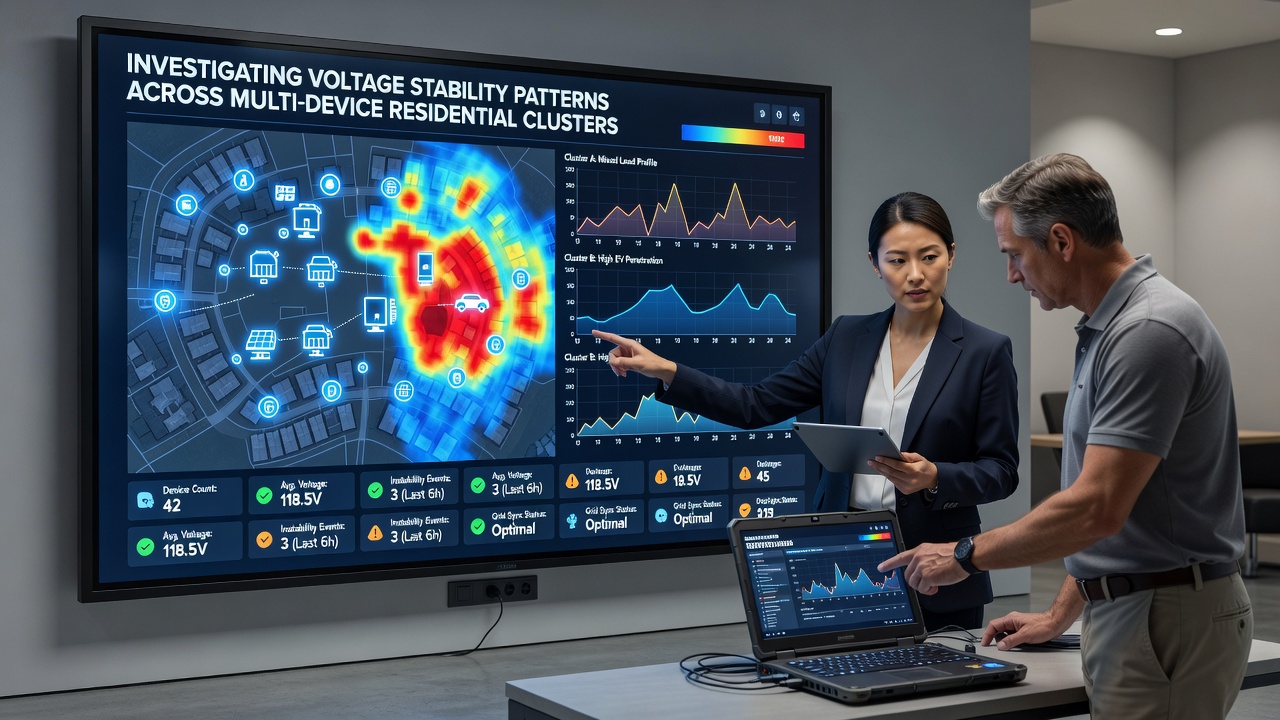
One multi-year project tracked twelve clusters across different climate zones and found that the addition of even two electric vehicle chargers per block increased the frequency of excursions beyond plus-or-minus five percent of nominal voltage. Those same records showed partial mitigation when chargers incorporated scheduled charging features that staggered start times by fifteen to thirty minutes.
Analytical Tools and Modeling Approaches
Engineers apply time-series clustering algorithms to group similar voltage signatures, then overlay device activation timestamps to identify causal sequences. These models highlight how certain combinations, such as simultaneous microwave and gaming console use in adjacent homes, produce resonant effects that single-home monitoring misses. Validation occurs through controlled load tests where researchers temporarily adjust device schedules in participating households and measure resulting changes in cluster-wide stability metrics.
Software platforms integrate these findings with utility planning tools so operators can forecast when infrastructure upgrades will become necessary as device adoption rates continue rising. Figures released in late 2026 indicate that predictive models now achieve 87 percent accuracy in identifying clusters likely to require reactive power compensation within the following twelve months.
Conclusion
Systematic investigation of voltage behavior across multi-device residential clusters supplies utilities and homeowners with actionable information for managing power quality. Continued data gathering through standardized monitoring networks supports refinement of both hardware specifications and operational practices that maintain stable supply as household technology profiles evolve.